Crossfilter
Generic interactive chart created on multivariate datasets as per the client requirement.
- Data Visualization
3Brain Technolabs is one of the Top Data Visualization Companies in India. Our team is Expert in Big Data Visualization and Data visualization Designs.
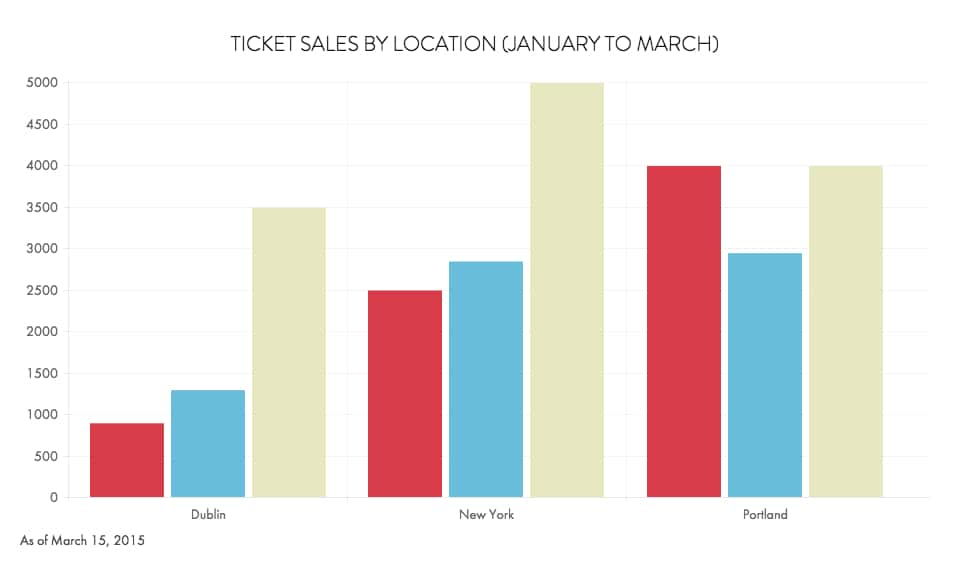
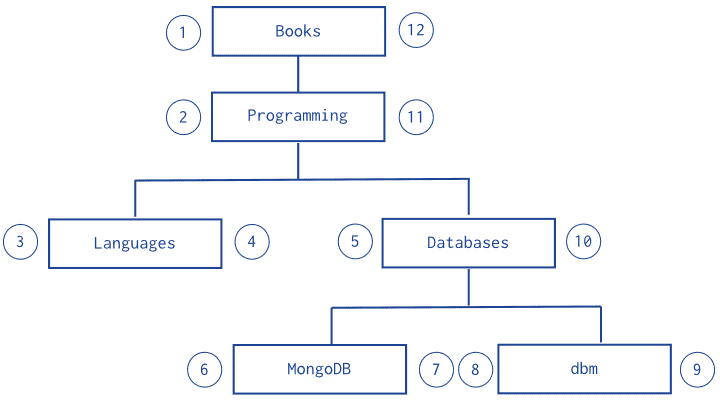
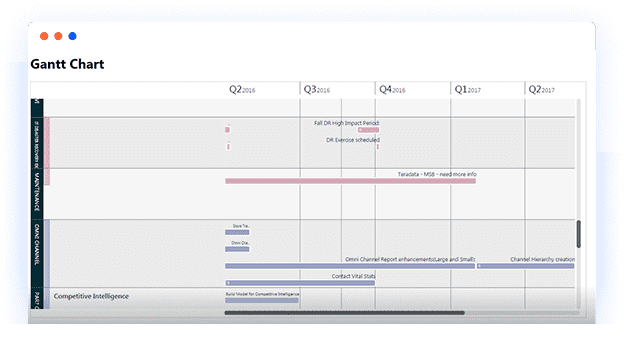
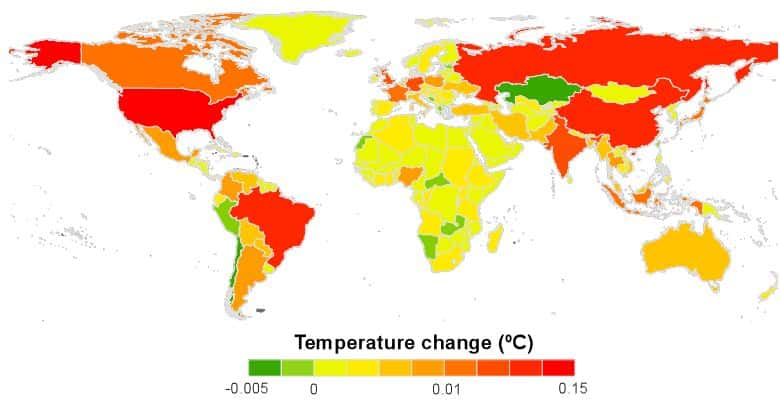
Understanding data using graphs, maps and pictures have been there in the industry. In current scenario being able to visualize the data is important to support insight and analysis of the key business factors more directly. The patterns, correlations, and trends might go undetected in text data but can be clearly detailed and recognize easier with data visualization. Data visualization design change the way we interact with data.
Big Data visualization helps to promote creative data exploration at 3Brain Technolabs, you will find the best practice recommendations to select which type of chart will get the solutions you seek.
Data visualization helps to promote creative data exploration; at 3Brain Technolabs, you will find the best practice recommendations to select which type of chart will get the solutions you seek.


